
Gait Height Analysis & Model
Gait Analysis: The systematic study of locomotion of organisms specifically the observation of human motion and is augmented by instrumentation for body mechanics and muscular kinetics.
This is the first project in the Engineering course. This is a non-engineering type project, more focused on statistical analysis than the hard sciences. The activity is designed to instill a procedural thinking method whilst observing a physical event. Thus the main objective of this project was to understand and prove what properties could be utilized in the composition of human walking gait. The most logical and scientific solution I had come up with was to use an Accelerometer in order to ascertain a quantum of all possible sub-gaits that could manipulate the walking trait. From that information, heavy analysis using visuals and finding statistical patterns lead to a model using the observed gaits to predict an unknown height of a human.
This is the first project in the Engineering course. This is a non-engineering type project, more focused on statistical analysis than the hard sciences. The activity is designed to instill a procedural thinking method whilst observing a physical event. Thus the main objective of this project was to understand and prove what properties could be utilized in the composition of human walking gait. The most logical and scientific solution I had come up with was to use an Accelerometer in order to ascertain a quantum of all possible sub-gaits that could manipulate the walking trait. From that information, heavy analysis using visuals and finding statistical patterns lead to a model using the observed gaits to predict an unknown height of a human.
Terms:
Accelerometer: A device that measures the physical acceleration experienced by an object.
Dynamicity: In terms of gait analysis, the quantification of variations in kinematic parameters within a period.
Gait: The stride of a human as s/he moves his/her limbs.
Metric: A quantitative indicator of a characteristic or attribute.
Model: In technology, a description of observed or predicted behavior of some system, simplified by ignoring certain details.
Symmetry: The quantification of differences between left-foot and right-foot steps.
Variability: The quantification of fluctuations from one stride to the next.
Materials:
Procedure:
Accelerometer: A device that measures the physical acceleration experienced by an object.
Dynamicity: In terms of gait analysis, the quantification of variations in kinematic parameters within a period.
Gait: The stride of a human as s/he moves his/her limbs.
Metric: A quantitative indicator of a characteristic or attribute.
Model: In technology, a description of observed or predicted behavior of some system, simplified by ignoring certain details.
Symmetry: The quantification of differences between left-foot and right-foot steps.
Variability: The quantification of fluctuations from one stride to the next.
Materials:
- Accelerometer
- Adhesive
- Measuring Tape
- Willing Testificate
Procedure:
- Orientate accelerometer in a logical position with correct X, Y, Z axis
- Use adhesive to secure the accelerometer on to willing testificate
- Measure testificates height & record value
- Testificate walks 10 Yards as naturally as possible
- Stop the subject & transport the data to CSV file (Comma Separated Values)
- Compare height values and X, Y, Z data points in the document
- Create reliable Gait Model to predict height
Gait Height model & analyzation process
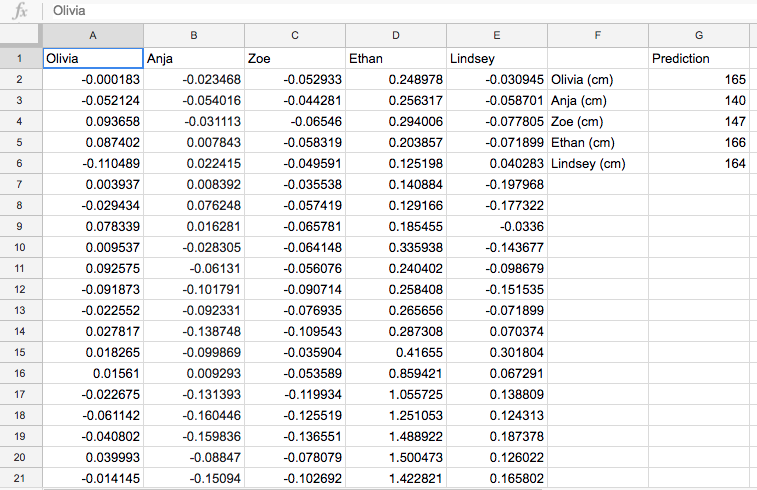
Class Data: docs.google.com/spreadsheets/
|
|
|
|
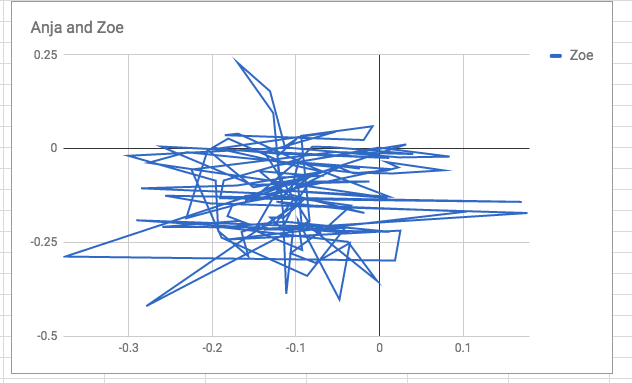
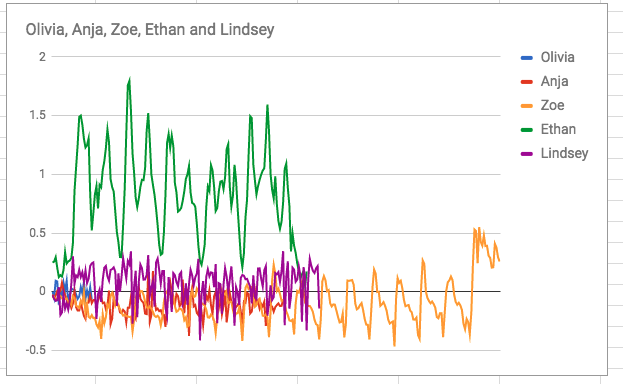
This Gait Analysis and Predictive Model is to illustrate and contrast the stark differences and similarities with some sample colleagues and I. Due to physical differences in shape there are different applicable values to use as an accurate measurement. Basically, to ascertain values with good predictability I would need exact shape and size to input into my model. For example, if a subject's leg length to body ratio was greater than average, (Measured ratio for common physique) the period of oscillation demonstrated within the accelerometer was generally unchanged; However the force (Measured in g's) had higher frequency and values. The minimum and maximum average values in particular had increased. My model works best when experimenting and computing in a theoretical world. Assuming there are -9.8N of force downwards (1 g), and a Normal Force of +1 g perpendicular to the surface, and if the subject has a constant traveling period (rate of step speed averaged over 10 steps, and if said subject was moving in a linear direction constant to that of our 3 Dimensional axis, we can reliably measure the frequency of g's in the Z and X direction. Y has a near constant force of gravity acting upon it (-1 g) so it can be thrown out of our model with negligible side effects. (Although depending on the spring of the leg and how they walk this value can change but remains mostly incalculable within my model).
Refection
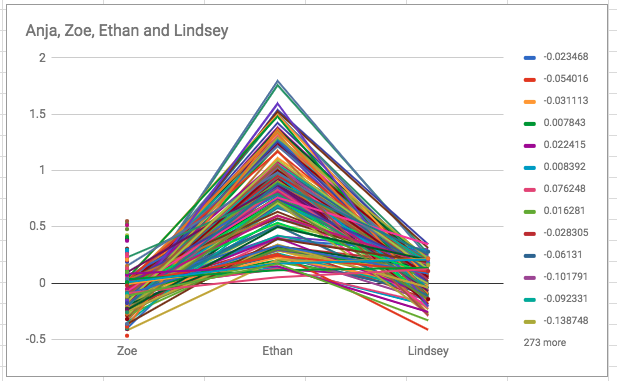
(See graphs above for reference) Although I sorted the data into a colourful abundance of information, this transition did little to clarify the data given. contrary to popular belief, both the line graph and the bar histogram displayed a lot of convoluted information not actually simplifying the data. It had quite the opposite effect intended in this gait analysis lab. In my case — With others as well upon further observation — the graph was malignant in understanding the nature of the information given in the CSV. The conclusion I had come to was decided through our processes of data comparison. Taking single points of data and contrasting them, finding the differential average between the arrays of data, and thought experiments were our main way of arriving to the logical solution. It is advised however that this method is rudimentary and involves guesswork. It should only be used in easy-to-digest analysis; not this one.
